
Special Investigation · Districts 2 & 4 · 7 Days to the Primary
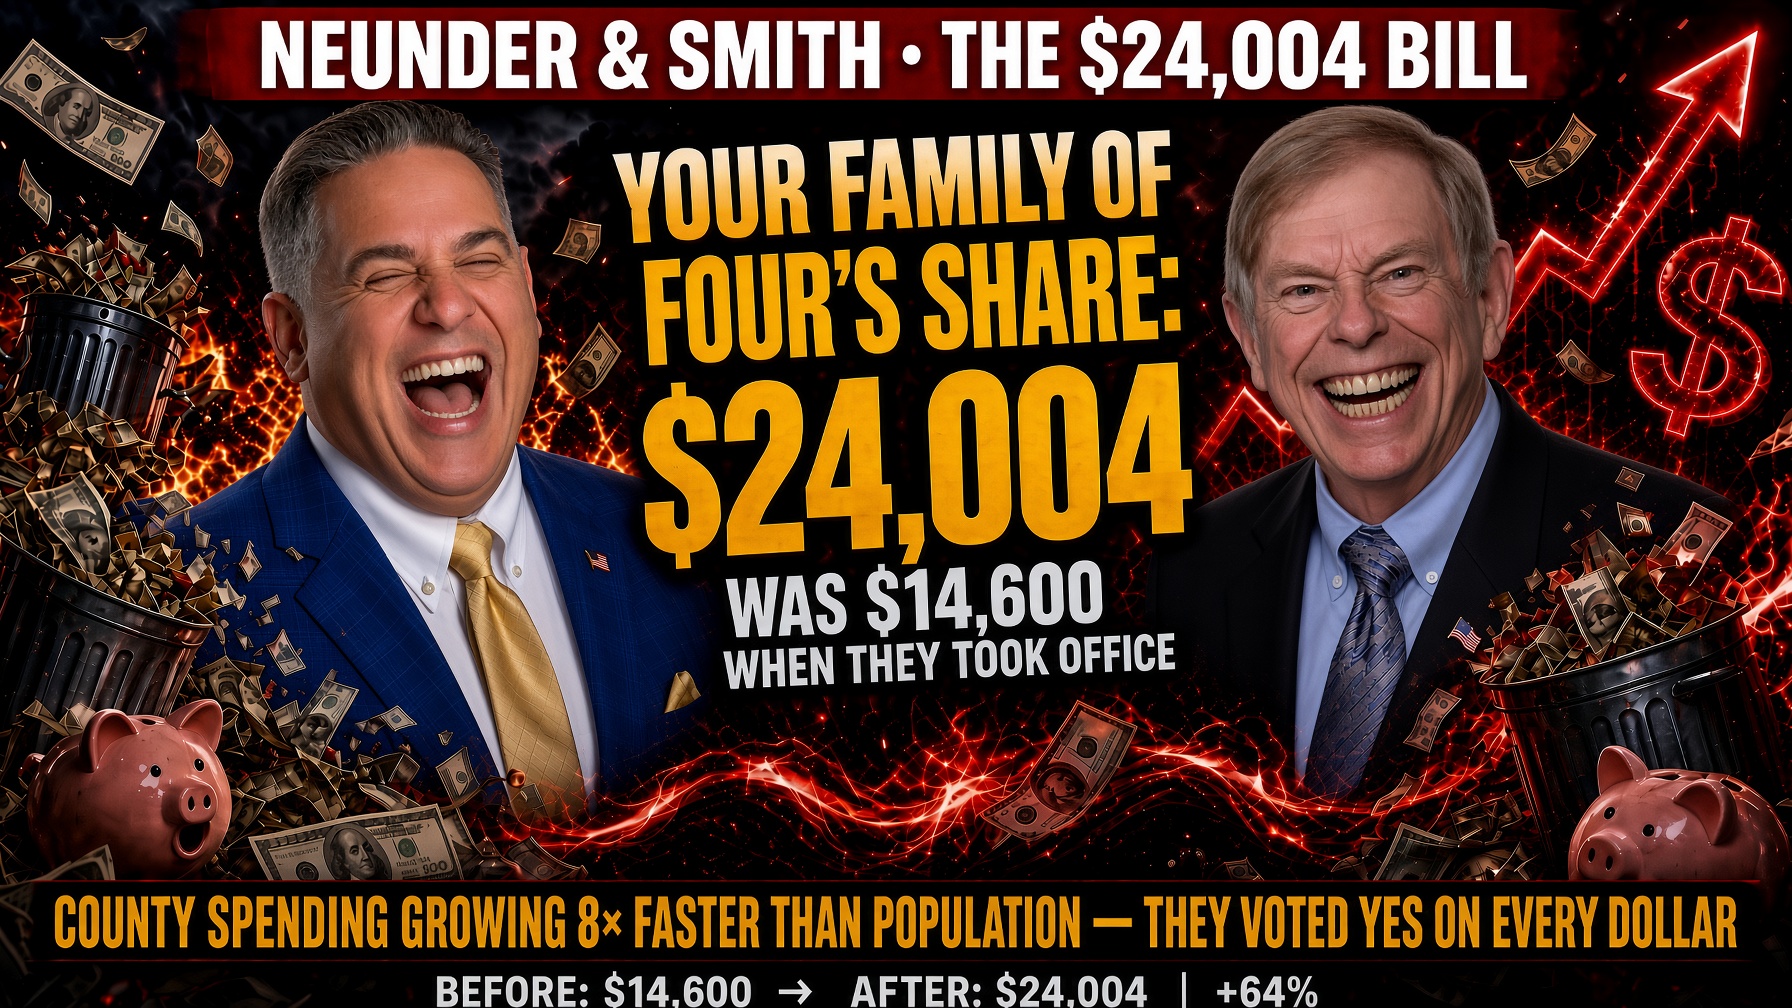
Neunder and Smith voted yes on every dollar — your family of four's share is now $24,004
It was $14,600 when they took office.
County spending is growing eight times faster than the population — and every dollar of it was approved by a unanimous board that included both of them.
If you live in District 2 or District 4, these are the only two commissioners on your ballot on August 18.
By the SarasotaCountyFacts.org Investigative Data Team
Reported from Washington, D.C. · Published August 10, 2026
WASHINGTON — Our data team spent months inside Sarasota County's own audited financial statements, its adopted budgets, and the official minutes of every board meeting since 2015. What the documents show is not a story about growth, inflation, or hurricanes. It is a story about a line that stayed flat for seven straight years — and then, the year Joe Neunder and Mark Smith took their seats, bent upward into the steepest spending and debt curve in the county's modern record. Nobody asked you. Nobody mailed you a bill. But you are paying it anyway — in your rent, your insurance, your groceries, and the price of everything in this county. Here is exactly where the money went, who voted for it, and the county's own documents to prove it.
Before you scroll through the charts, four findings from the record stand on their own. Each one is documented below, in the county's own numbers:
- The very first budget they voted on jumped county spending plans 38.5% in a single year — the largest one-year increase in the modern record. They have voted YES on every budget and every millage since: 15 for 15, without one dissent.
- It took Sarasota County its entire history to accumulate $827 million in debt. On their watch it is headed to roughly $1.45 billion — and the county's own documents put the total payback bill, with interest, at $2.1 billion.
- Growth did not do this. In the seven years before they took office, the county absorbed 60,288 new residents with a per-person burden that barely moved. On their watch, population growth slowed to 9.5% — and spending grew eight times faster.
- They cut the tax rate and collected $64 million more. The “millage cut” they campaign on is a rounding error against property values that soared — your actual bill went up, and they know it.
- $24,004 — your family of four's share of county spending + debt this year(it was $14,600 when they took office)
- +64% — how much that burden grew in just four years($3,648 → $6,001 per resident)
- 15 for 15 — every budget and millage they voted on: YES($9.16 billion in total spending authority)
- 0 — times either of them voted NO on spending, millage, or bonds
The 30-second record
- ■For seven years before they took office, county spending and debt per person stayed nearly flat. That is what normal looks like.
- ■Joe Neunder and Mark Smith took their seats in November 2022. The flat line ended. Everything above happened on the budgets that followed — and they voted YES on every one of them.
- ■They inherited $823 million in annual spending and $827 million in debt. Both crossed $1 billion for the first time in county history on their watch.
- ■Your combined burden is now $6,001 per person — $24,004 for a family of four.
- ■They never once voted against a budget, a millage rate, or a bond.
Every number comes from Sarasota County's own audited financial reports and official board minutes.
“It took Sarasota County its entire history to borrow its first $827 million. Neunder and Smith nearly doubled it in four years.”
What $24,004 actually means for you and your family
If you rent: your landlord's higher property-tax and insurance bills are baked into your monthly rent. When the per-person county burden rises 64% in four years, that pressure lands on your rent check.
If you own a home: you pay it directly on your tax bill. The debt is the quiet part. Nearly $1.5 billion of county borrowing is not paid by “the government.” It is paid by every future tax bill in this county — including your children's — for decades. The county's own documents put the total payback with interest at $2.1 billion.
If you are on a fixed income: every extra dollar the county spends or borrows works its way into groceries, gas, insurance, and services from businesses that pay higher county taxes and fees and pass them straight into their prices.
And here's the kicker: population growth doesn't explain any of this — the record proves it. From 2015 to 2022, Sarasota County added 60,288 residents (+15.4%) and the per-person burden stayed essentially flat: $3,132 to $3,648. Under Neunder and Smith, growth slowed to +9.5% (42,889 more residents by 2026) — and roughly four in ten of the new arrivals through 2025 landed in North Port, a city that levies its own taxes and builds its own infrastructure. Yet combined county spending and debt jumped $1.28 billion (+77%) — eight times faster than the population grew. More neighbors should mean the cost gets shared by more people. Instead, each person's slice got 64% bigger.

“Nobody mailed you a $24,004 bill. You're paying it anyway — in rent, insurance, groceries, and every price in this county.”
The voting record that produced these numbers
Both men voted YES on every budget and every bond of their term. Fifteen budget and millage votes, every borrowing resolution, without one dissent between them.
A NO was possible: one commissioner (Tom Knight) proved it on the FY2026 budget. Neunder and Smith both voted YES.

The receipts · Data brief
Don't take our word for it. Here is every number, sourced to the county's own documents.
Every figure below comes from each government's own audited Annual Comprehensive Financial Report (“ACFR” — the official year-end financials, checked by outside accountants) — extracted from the official statistical tables and cross-verified digit-for-digit across two report years per government. Per-resident figures use the state economist's official population estimates. All five governments' fiscal years end September 30. Audited through FY2025 except the City of Sarasota (FY2024). Published August 2026.
Exhibit 1
The flat line ended the year Neunder and Smith took office — and your family's share started climbing
Sarasota County government: total spending per resident and total debt outstanding per resident, FY2015–FY2025 audited, plus the FY2026 year-end pro forma (dashed) — the fourth and final full fiscal year of the Neunder–Smith term. Joe Neunder (District 4) and Mark Smith (District 2) were elected November 8, 2022 and sworn in November 22, 2022 — seven weeks into FY2023.
How to read it: for seven straight years (FY2015–FY2021) spending per resident crept from $1,550 to $1,734 — an average of about $26 a year — and debt per resident actually fell, from $1,582 to $1,601 with a dip to $1,437. From FY2022 to FY2025, spending per resident jumped from $1,820 to $2,499 (+$679) and debt per resident from $1,829 to $2,523 (+$694). Combined burden per resident: $3,132 (2015) → $3,335 (2021) → $5,022 (2025) → ≈$6,001 by September 30, 2026 (pro forma)¹. Population grew 10% over the same four years — these are per-person figures, so growth does not explain the break. This is the exact moment the bill for working families began rising. Every budget that produced these numbers received their YES vote.
¹ FY2026 pro forma method (not audited — the FY2026 ACFR publishes in early 2027): projected spending and debt are taken from the county's own certified documents — the Adopted FY2026 Financial Plan (996 pp.) and the Preliminary FY2027 Financial Plan. Spending ≈$1,472M applies FY2025's audited realization ratio (audited expenses were 58.3% of the adopted budget) to the adopted FY2026 budget of $2,524,495,075. Debt ≈$1,454M repeats FY2025's actual net debt growth (+$224.0M) on FY2025's audited $1,230.3M — corroborated by the Adopted FY2026 Plan itself, which schedules $158,128,202 of new FY2026 borrowing (Sheriff facility, Fire/EMS, surtax projects) and states total committed principal-and-interest of $2,104,565,409. The per-resident figures deliberately assume no additional population growth: the denominator holds the FY2025 EDR population (487,640) flat rather than adopting the state's 2026 projection, because that projected increase is concentrated in unincorporated growth corridors and North Port, is not yet realized or audited, and mixing a forecast denominator into document-anchored numerators would dilute the fiscal change this exhibit isolates. Even the most conservative floor — FY2024's lower expense ratio and only the county's own scheduled borrowing net of principal paydown — yields ≈$5,246 per resident.
Shareable version
A picture worth a thousand words — download and share
The combined spending-plus-debt burden per resident, FY2015–FY2025 audited plus the FY2026 pro forma¹, from the same data as Exhibit 1. The “on their watch” figure uses the honest baseline: FY2022 ($3,648), the last audited fiscal year before Neunder and Smith took office, to the FY2026 year-end estimate ($6,001) — +$2,353 per resident (+64%), of which +$1,374 is already audited through FY2025.
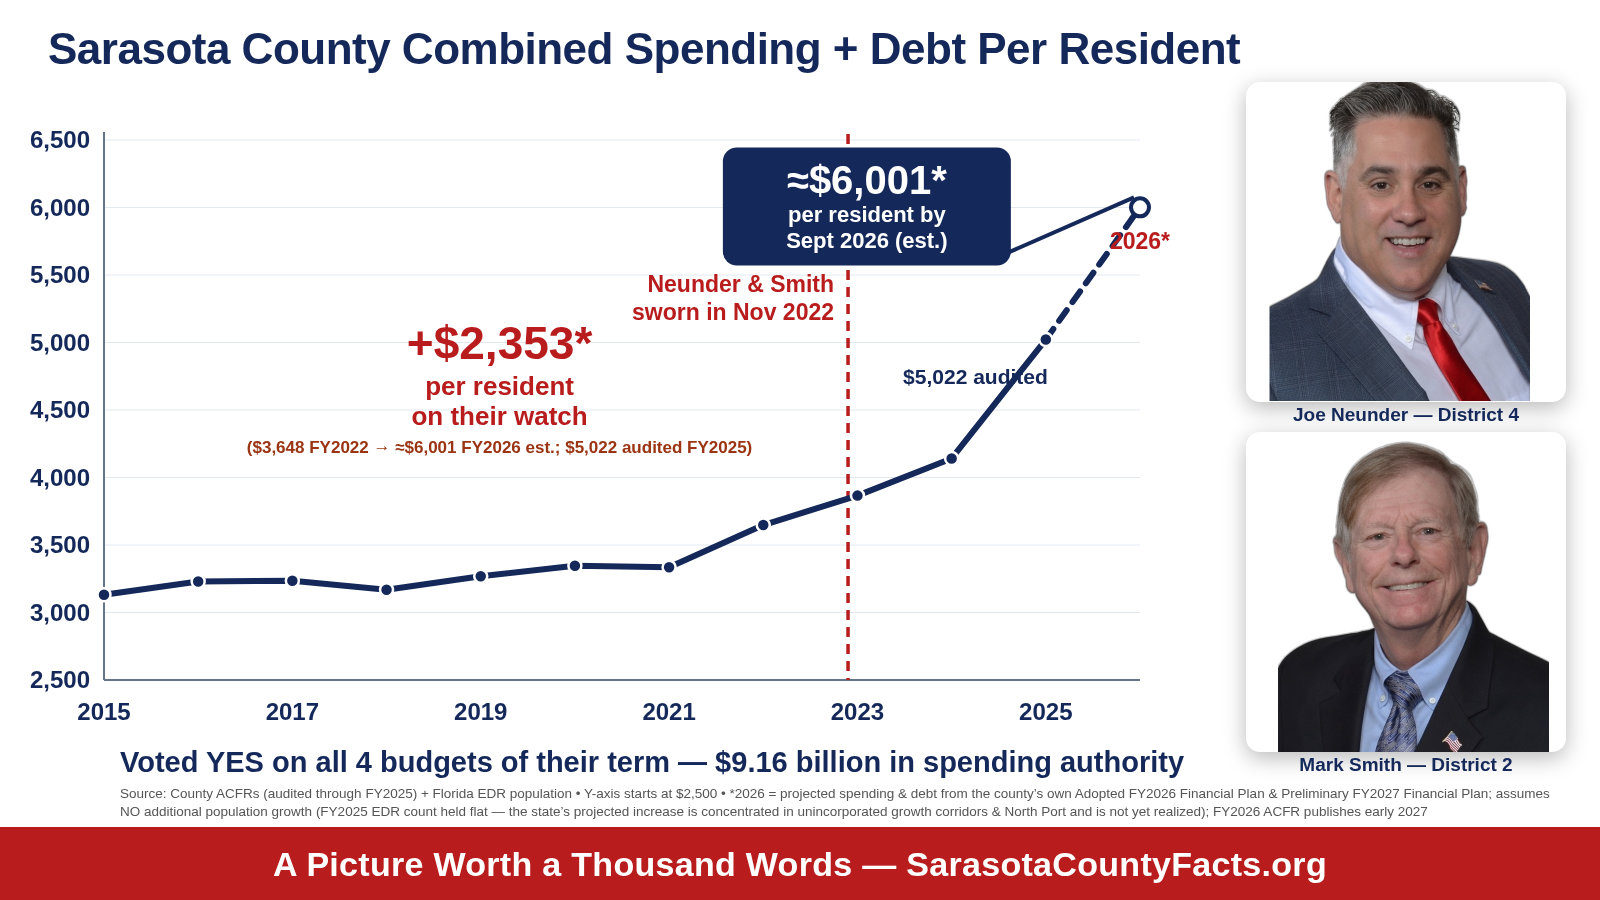
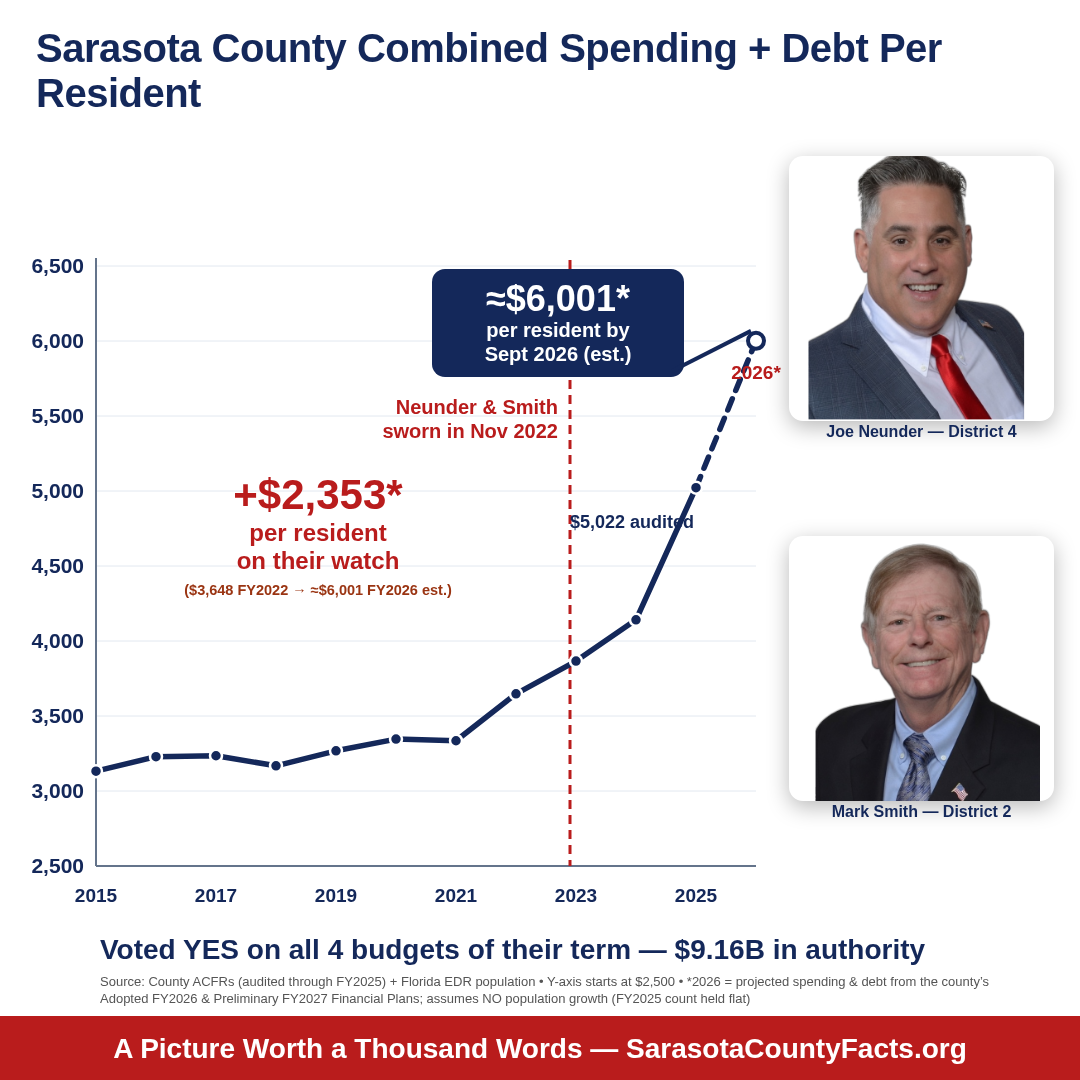
Exhibit 2
Both spending and debt crossed $1 billion for the first time in the county's 105-year history — on budgets they both voted for
Sarasota County government: total spending (accrual expenses) and total debt outstanding, FY2015–FY2025 audited, plus the FY2026 pro forma¹ (dashed).
*FY2026 (dashed, open circles) is the pro forma from the county's own adopted plans — see footnote ¹ in Exhibit 1. Audited values: FY2025 spending $1,218.6M, debt $1,230.3M.
Source: Sarasota County FY2025 and FY2024 ACFRs, Statistical Section (Changes in Net Position; Ratios of Outstanding Debt by Type). FY2026 pro forma¹: Adopted FY2026 Financial Plan + Preliminary FY2027 Financial Plan.
- ■Two billion-dollar thresholds, one term. In the 105 years since Sarasota County was created in 1921, neither total spending nor total debt had ever crossed $1 billion. Both crossed it during the Neunder–Smith years.
- ■Debt grew +$404 million audited (FY2022 $826.1M → FY2025 $1,230.3M) — a 49% jump in three audited years, before FY2026's scheduled $158.1M of new borrowing.
- ■The payback bill is bigger than the debt: the county's own schedules put total repayment, with interest, at $2.1 billion.
Exhibit 2A
Population growth does not explain this. Their YES votes do.
Both lines indexed to FY2015 = 100 so they share one axis. If spending merely kept pace with growth, the two lines would sit on top of each other. They did — for seven years. Then Neunder and Smith were sworn in.
*FY2026 (dashed, open circles): spending is the pro forma¹ from the county's own adopted plans; population is the state economist's 2026 projection (495,267). Audited FY2015–FY2025: population +24.4% — spending +100.4%.
How to read it: from FY2015 through FY2022 the county absorbed 60,288 new residents (+15.4%) while the spending line tracked modestly above population — the normal cost of serving more people. From FY2022 to FY2026 the population line rises just 9.5 points more. The spending line rises 107 points in the same window. Growth did not slow down the moment they took office and then explode — spending did.
Exhibit 2B
Strip out the four cities that tax and build for themselves, and the excuse gets even worse
Same chart, but the population line now counts ONLY residents of unincorporated Sarasota County — excluding North Port, City of Sarasota, Venice, and Longboat Key, each of which levies its own taxes and funds its own infrastructure. These are the residents county government most directly serves.
*FY2026 (dashed, open circles): spending pro forma¹; the unincorporated line deliberately assigns all of the state's projected 2026 countywide increase to the unincorporated area — the assumption most favorable to the county. Audited FY2015–FY2025 unincorporated growth: +19.1% (248,687 → 296,149) vs. spending +100.4%.
Why this cut matters: since Neunder and Smith took office, roughly four in ten of the county's new residents landed in North Port alone — a city with its own commission, its own millage, and its own roads budget. The people unincorporated county government actually serves grew just 5.8% audited under their watch (FY2022→FY2025), while county spending grew 48.2% audited — and 79% through the FY2026 pro forma¹. Whichever population you measure, the spending curve left it behind the year they arrived.
Exhibit 3
Sarasota County: the complete verified series
Shaded rows are the Neunder–Smith years (FY2023 was their first fiscal year in office; FY2024 was the first budget they adopted). FY2026 is the year-end pro forma — see footnote ².
| Fiscal year | Spending | Debt | Population | Spend / person | Debt / person | Combined / person |
|---|---|---|---|---|---|---|
| FY2015 | $607,622,968 | $620,286,000 | 392,090 | $1,550 | $1,582 | $3,132 |
| FY2016 | $664,778,121 | $625,502,000 | 399,538 | $1,664 | $1,566 | $3,230 |
| FY2017 | $698,667,304 | $618,793,000 | 407,260 | $1,716 | $1,519 | $3,235 |
| FY2018 | $722,473,638 | $600,013,000 | 417,442 | $1,731 | $1,437 | $3,168 |
| FY2019 | $764,352,303 | $628,885,000 | 426,275 | $1,793 | $1,475 | $3,268 |
| FY2020 | $803,974,067 | $648,029,000 | 434,006 | $1,852 | $1,493 | $3,345 |
| FY2021 | $765,631,520 | $706,853,000 | 441,508 | $1,734 | $1,601 | $3,335 |
| FY2022 | $823,178,295 | $827,292,000 | 452,378 | $1,820 | $1,829 | $3,649 |
| FY2023 | $968,754,151 | $826,147,000 | 464,223 | $2,087 | $1,780 | $3,867 |
| FY2024 | $977,119,786 | $1,006,346,000 | 479,027 | $2,040 | $2,101 | $4,141 |
| FY2025 | $1,218,555,245 | $1,230,309,000 | 487,640 | $2,499 | $2,523 | $5,022 |
| FY2026 pro forma ² | $1,472,374,181 | $1,454,272,000 | 487,640 (held flat) | $3,019 | $2,982 | $6,001 |
² FY2015–FY2025 are audited accrual actuals. The FY2026 row is a PRO FORMA, not audited: projected spending and debt are derived from the county's own Adopted FY2026 Financial Plan and Preliminary FY2027 Financial Plan (spending = FY2025's audited 58.3% realization ratio applied to the adopted $2,524,495,075 budget; debt = FY2025 audited debt plus FY2025's actual net growth, corroborated by the plan's own $158.1M of scheduled new FY2026 borrowing). Population deliberately assumes NO additional growth — the FY2025 EDR count is held flat rather than adopting the state's 2026 projection, since that projected increase is concentrated in unincorporated growth corridors and North Port and is not yet realized or audited. The audited FY2026 ACFR (early 2027) will supersede this row. The gross FY2026 adopted budget itself is NOT shown in this series — an all-funds budget is roughly twice accrual expenses by construction; budget-to-budget outlook is in Exhibit 10.
Source: Sarasota County FY2025 ACFR (FY2016–FY2025, verified against the FY2024 ACFR for every overlapping year); FY2024 ACFR (FY2015). FY2026 pro forma: Adopted FY2026 Financial Plan + Preliminary FY2027 Financial Plan. Population: Florida EDR, April 1 estimates.
Exhibit 4
Before and after: the seven years prior vs. the Neunder–Smith years
Average annual change in Sarasota County per-resident figures.
| Measure | FY2015 → FY2022 (7 yrs) | FY2022 → FY2025 (3 yrs) | Acceleration |
|---|---|---|---|
| Spending / resident, avg. change per year | +$39 | +$226 | 5.8× |
| Debt / resident, avg. change per year | +$35 | +$231 | 6.6× |
| Combined / resident, avg. change per year | +$74 | +$458 | 6.2× |
| Total spending, avg. change per year | +$30.8M | +$131.8M | 4.3× |
| Total debt, avg. change per year | +$29.6M | +$134.3M | 4.5× |
Source: Computed from Exhibit 3.
- ■Read that table again: every single measure accelerated four- to six-fold the moment they arrived. There is no gradual trend here — there is a before, and there is an after.
- ■In the seven years before them, your per-person share grew $74 a year. Under them, $458 a year — every year, compounding.
Every measure. Four to six times faster. The year they took their seats.
Exhibit 5
Debt per resident, 2015 vs. latest audited year: the county went one way, its largest city went the other
Same accounting basis, same population source, every jurisdiction.
| Jurisdiction | Debt / person, FY2015 | Debt / person, latest audited | Change |
|---|---|---|---|
| Sarasota County | $1,582 | $2,523 (FY25) | +59% |
| City of North Port | $1,308 | $1,011 (FY25) | −23% |
| City of Venice | $2,304 | $2,826 (FY25) | +23% |
| City of Sarasota | $2,316 | $3,123 (FY24) | +35% |
| Town of Longboat Key | $1,903 | $5,633 (FY25) | +196% |
Source: Each government's own ACFR, latest audited year (FY2025 for all except City of Sarasota, FY2024).
Exhibit 6
City of North Port: nine years of debt paydown, then a FY2025 reversal
| Fiscal year | Spending | Debt | Population | Spend / person | Debt / person | Combined / person |
|---|---|---|---|---|---|---|
| FY2015 | $86.2M | $81.4M | 62,235 | $1,385 | $1,308 | $2,693 |
| FY2016 | $84.9M | $75.3M | 64,472 | $1,316 | $1,167 | $2,483 |
| FY2017 | $100.4M | $70.2M | 67,196 | $1,495 | $1,045 | $2,540 |
| FY2018 | $108.7M | $67.2M | 70,631 | $1,538 | $951 | $2,489 |
| FY2019 | $114.8M | $60.6M | 73,652 | $1,559 | $823 | $2,382 |
| FY2020 | $126.6M | $58.2M | 77,561 | $1,632 | $750 | $2,382 |
| FY2021 | $122.1M | $53.5M | 78,129 | $1,563 | $685 | $2,248 |
| FY2022 | $146.6M | $48.6M | 81,823 | $1,791 | $594 | $2,385 |
| FY2023 | $222.4M | $46.5M | 86,552 | $2,570 | $537 | $3,107 |
| FY2024 | $197.2M | $43.3M | 92,399 | $2,134 | $468 | $2,602 |
| FY2025 | $214.9M | $97.3M | 96,301 | $2,231 | $1,011 | $3,242 |
Debt fell every year from $81.4M (FY2015) to $43.3M (FY2024) — cut nearly in half while population grew 48% — then $58.1M of new Sales Tax Revenue Bonds in FY2025 took debt to its highest dollar level in city history. FY2023–24 debt uses the FY2025 ACFR's restated Schedule 9 (SBITAs added). FY2026 adopted budget: $321,990,920 (budgetary basis).
Source: City of North Port FY2025 ACFR (audited through FY2025; cross-verified against the FY2024 and FY2023 ACFRs).
Exhibit 7
City of Venice: two bond generations
| Fiscal year | Spending | Debt | Population | Spend / person | Debt / person | Combined / person |
|---|---|---|---|---|---|---|
| FY2015 | $53.0M | $49.3M | 21,418 | $2,475 | $2,304 | $4,779 |
| FY2016 | $62.3M | $44.9M | 21,849 | $2,851 | $2,054 | $4,905 |
| FY2017 | $61.8M | $78.4M | 22,306 | $2,770 | $3,513 | $6,283 |
| FY2018 | $67.8M | $77.0M | 22,781 | $2,977 | $3,381 | $6,358 |
| FY2019 | $65.7M | $75.1M | 23,315 | $2,819 | $3,222 | $6,041 |
| FY2020 | $71.0M | $74.9M | 24,016 | $2,955 | $3,119 | $6,074 |
| FY2021 | $68.6M | $72.3M | 26,103 | $2,627 | $2,770 | $5,397 |
| FY2022 | $74.7M | $69.2M | 26,728 | $2,795 | $2,589 | $5,384 |
| FY2023 | $99.5M | $65.1M | 27,793 | $3,579 | $2,343 | $5,922 |
| FY2024 | $88.6M | $63.6M | 28,967 | $3,059 | $2,195 | $5,254 |
| FY2025 | $93.5M | $84.2M | 29,802 | $3,137 | $2,826 | $5,963 |
The 2017 debt jump is the voter-approved public-safety GO bond; the 2025 jump is new revenue bonds and notes. The 2021 population step is the 2020 Census revision, not one-year migration. FY2026 adopted budget total pending verification against the city's own document.
Source: City of Venice FY2025 ACFR (audited through FY2025; cross-verified against the FY2021 ACFR).
Exhibit 8
City of Sarasota: audited through FY2024
| Fiscal year | Spending | Debt | Population | Spend / person | Debt / person | Combined / person |
|---|---|---|---|---|---|---|
| FY2015 | $145.1M | $122.5M | 52,905 | $2,742 | $2,316 | $5,058 |
| FY2016 | $145.5M | $112.8M | 53,865 | $2,701 | $2,093 | $4,794 |
| FY2017 | $153.6M | $104.3M | 54,641 | $2,811 | $1,909 | $4,720 |
| FY2018 | $153.0M | $120.8M | 55,832 | $2,741 | $2,163 | $4,904 |
| FY2019 | $179.9M | $121.8M | 56,692 | $3,173 | $2,149 | $5,322 |
| FY2020 | $157.6M | $116.4M | 57,683 | $2,733 | $2,017 | $4,750 |
| FY2021 | $141.4M | $126.9M | 55,386 | $2,552 | $2,291 | $4,843 |
| FY2022 | $145.1M | $153.7M | 56,494 | $2,569 | $2,721 | $5,290 |
| FY2023 | $197.8M | $192.0M | 57,005 | $3,470 | $3,367 | $6,837 |
| FY2024 | $221.9M | $181.0M | 57,943 | $3,829 | $3,123 | $6,952 |
Debt jump FY2022→FY2023 (+$38M) is the special-obligation bond issuance (Bobby Jones / capital program). The 2021 population dip is the 2020 Census revision. FY2025 adopted budget: $305,678,879; FY2026 adopted budget: $303,575,381 — the city's budget declined 0.7% year-over-year (both budgetary basis, from the city's own budget books).
Source: City of Sarasota FY2024 ACFR (cross-verified against the FY2022 ACFR); FY2025 and FY2026 Adopted Budget books.
Exhibit 9
Town of Longboat Key: the county's highest per-resident debt, now paying down
| Fiscal year | Spending | Debt | Population | Spend / person | Debt / person | Combined / person |
|---|---|---|---|---|---|---|
| FY2015 | $25.3M | $13.0M | 6,845 | $3,692 | $1,904 | $5,596 |
| FY2016 | $28.6M | $22.9M | 6,879 | $4,153 | $3,331 | $7,484 |
| FY2017 | $33.7M | $19.4M | 6,934 | $4,858 | $2,803 | $7,661 |
| FY2018 | $32.5M | $21.8M | 6,990 | $4,646 | $3,116 | $7,762 |
| FY2019 | $33.7M | $52.1M | 7,043 | $4,781 | $7,392 | $12,173 |
| FY2020 | $34.1M | $47.6M | 7,098 | $4,808 | $6,711 | $11,519 |
| FY2021 | $37.2M | $63.6M | 7,519 | $4,943 | $8,458 | $13,401 |
| FY2022 | $39.3M | $58.3M | 7,519 | $5,228 | $7,749 | $12,977 |
| FY2023 | $39.0M | $52.9M | 7,537 | $5,175 | $7,014 | $12,189 |
| FY2024 | $40.5M | $47.5M | 7,532 | $5,378 | $6,305 | $11,683 |
| FY2025 | $72.0M | $41.9M | 7,445 | $9,674 | $5,633 | $15,307 |
Debt tripled in FY2019 (undergrounding revenue bonds) and peaked in FY2021 at $8,458 per resident — the highest of any government in the county — then fell for four straight years to $5,633. FY2025 spending rose 78% ($40.5M → $72.0M): hurricane Helene/Milton recovery. Population is the full town, including the Manatee County side.
Source: Town of Longboat Key FY2025 ACFR (audited through FY2025; cross-verified against the FY2024 ACFR).
Exhibit 10
County budget-to-budget: the FY2026 adopted budget jumped 20.8% in a single year ��� and its debt-service line jumped 56%
Adopted budgets compared only against other adopted budgets (same budgetary basis, all funds including reserves and transfers). A gross budget is roughly twice accrual expenses by construction — the two measures must never share a table column or chart line.
| County budget | Total (all funds) | Change vs. prior | Debt service line |
|---|---|---|---|
| FY2024 adopted | $2,014,910,533 | — | $102,109,340 |
| FY2025 adopted | $2,089,303,625 | +4% | $95,406,272 |
| FY2026 adopted | $2,524,495,075 | +21% | $149,128,818 |
| FY2027 preliminary | $2,530,632,539 | +0% | $109,270,219 |
The FY2026 debt-service appropriation of $149.1M (up from $95.4M in FY2025, +56%) is the county's own budget confirming the debt trajectory going forward. The FY2027 preliminary plan holds the total roughly flat but projects debt service back down — a projection, not a commitment.
Source: Sarasota County adopted budget documents, FY2024–FY2026, and FY2027 Preliminary Financial Plan (verified line-by-line against the county's own books). FY2026: Resolution 2025-163, adopted Sept 24, 2025, 3–1, Knight dissenting.
- ■The debt-service line is the tell: a 56% one-year jump in what the county must pay just to service its borrowing. That line item alone — $149.1 million — is the county's own budget admitting the debt curve is real.
- ■One commissioner proved a NO was possible. The FY2026 budget passed 3–1, Tom Knight dissenting. Neunder and Smith both voted YES — as they did at every budget and millage adoption of their term, 15 for 15.
Exhibit 11
The Neunder–Smith term scorecard: four budget votes, $9.16 billion in spending authority
Sworn in November 22, 2022, their term covers exactly four county budget cycles — FY2024, FY2025, FY2026 (each adopted), and FY2027 (adopted September 2026, before the term ends). The last budget adopted before they took office, FY2023, is the honest baseline.
| Budget year | Total (all funds) | vs. FY2023 pre-term baseline | Debt service line |
|---|---|---|---|
| FY2023 (pre-term baseline) | $1,455,000,000* | — | n/a |
| FY2024 adopted — voted | $2,014,910,533 | +38% | $102,109,340 |
| FY2025 adopted — voted | $2,089,303,625 | +44% | $95,406,272 |
| FY2026 adopted — voted | $2,524,495,075 | +74% | $149,128,818 |
| FY2027 preliminary — voted | $2,530,632,539 | +74% | $109,270,219 |
| Term total (4 budgets) | $9,159,341,772 | $455,914,649 |
*FY2023 total from the county's own Citizens Guide chart (“Total Budgets FY22–FY26”), published rounded to millions. FY2027 is the preliminary plan total; the adoption vote is September 2026.
From the county's own documents: the FY2023 pre-term budget was $1.455 billion (county Citizens Guide chart, rounded). Their first budget vote — FY2024 — jumped it 38.5% in a single year, and by FY2027 the budget stands 74% above the pre-term baseline. The four budgets they voted (or will vote) total $9,159,341,772 in spending authority, carrying $455,914,649 in combined debt-service appropriations. The FY2027 Preliminary Financial Plan they will vote on this September commits $609.8M (24.1% of the budget) to capital and debt service and launches a five-year FY2027–FY2031 Capital Improvement Program. On the audited side, total county debt rose from $826.1M (FY2022, pre-term) to $1,230.3M (FY2025) — +$404M, +49% — with FY2026's audit still to come.
Source: Sarasota County Citizens Guide to the Adopted FY26 Budget (county Communications, 10/21/2025); FY2024–FY2026 adopted budget documents; Preliminary FY2027 Financial Plan incl. CIP FY2027–FY2031 (July 16, 2026); FY2025 ACFR. All archived in the project document store.
- ■$9.16 billion in spending authority across the four budgets of their term — carrying $455.9 million in debt-service appropriations alone.
- ■Their very first vote set the tone: FY2024 jumped the budget 38.5% over the pre-term baseline in one year. By FY2027 it stands 74% above where they found it.
- ■And one more is coming: this September — weeks before the election — they vote on a FY2027 plan that commits $609.8 million to capital and debt service and launches a five-year borrowing program.
Exhibit 12
FY2026 adopted budgets, all jurisdictions (budgetary basis)
| Jurisdiction | FY2026 adopted budget | Basis note |
|---|---|---|
| Sarasota County | $2,524,495,075 | All funds incl. reserves & transfers |
| City of North Port | $321,990,920 | Excl. transfers & retained earnings |
| City of Sarasota | $303,575,381 | Summary of All Funds (p. 83) |
| City of Venice | pending | Awaiting the city's own document |
| Town of Longboat Key | pending | Awaiting the town's own document |
Source: Each government's adopted FY2026 budget document, archived in the project document store.
There are two other candidates on the August 18 ballot.

In District 2: Kristina Sargent is challenging Mark Smith. She has made the county's spending trajectory and infrastructure priorities the center of her campaign.
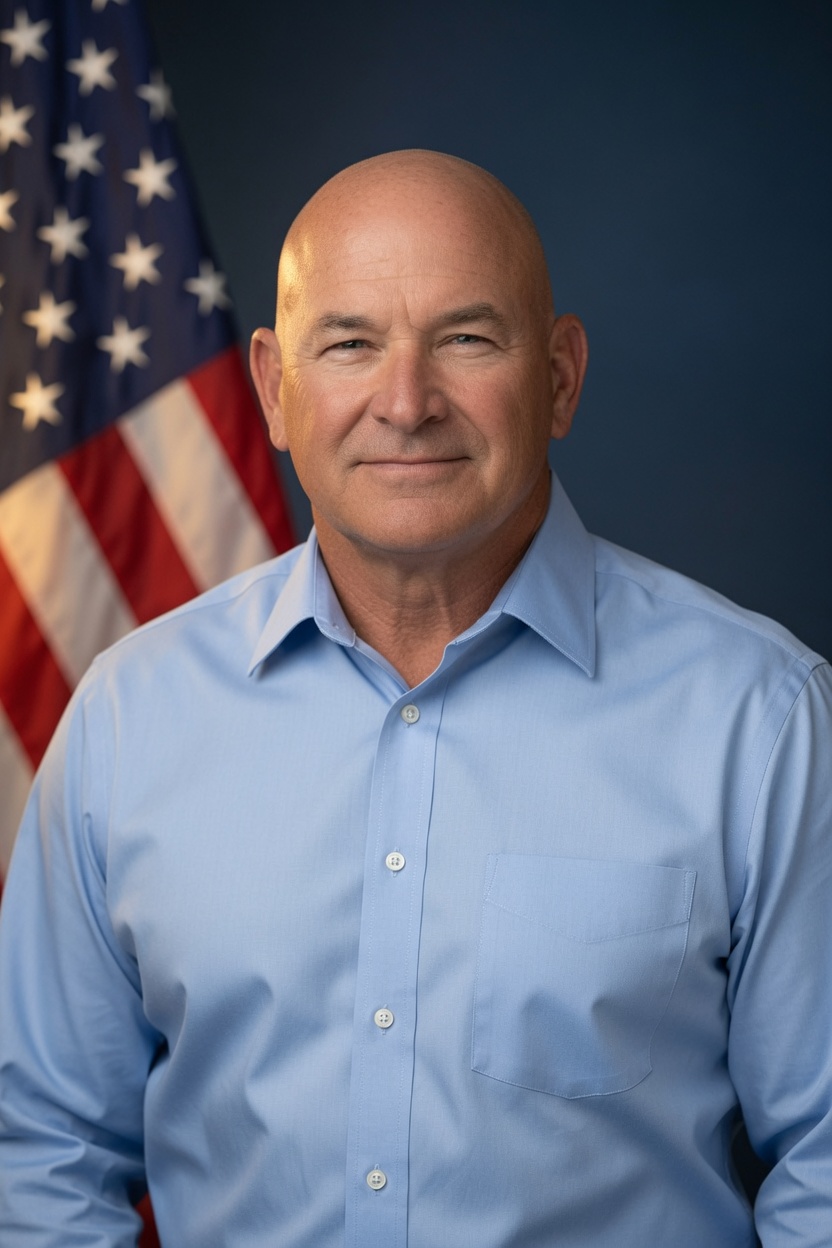
In District 4: Jim DeNiro is challenging Joe Neunder.
The primary is open to every registered voter in those districts and decides the seats. There is no November contest for either.
You have seen the record. On August 18, Districts 2 and 4 decide whether it continues.
Friends don't let friends vote until they've seen this
Sarasota's working families can't out-spend the special interests — but we can out-share them. Send this page to five neighbors in District 2 or District 4 before August 18. Every share is a doorstep conversation the insiders can't buy back.
Methodology & sources(all figures from the county's own ACFRs, board minutes, and adopted budgets — tap to expand)
- Spending = ACFR Statistical Section, “Changes in Net Position,” Total Primary Government expenses (governmental + business-type activities, accrual basis).
- Debt = ACFR Statistical Section, “Ratios of Outstanding Debt by Type,” total primary government: GO bonds, revenue bonds, commercial paper, leases, SBITAs, and notes.
- Population = Florida Legislature Office of Economic & Demographic Research (EDR), official April 1 estimates. Each Oct–Sep fiscal year contains exactly one April 1 estimate — the FY-end year's — and per-capita figures divide FY totals by that estimate, uniformly across all five governments.
- Verification: every overlapping year was extracted independently from two different ACFR vintages per jurisdiction and matched digit-for-digit before publication.
- Election timing: Neunder and Smith won the Nov 8, 2022 general election and were sworn in Nov 22, 2022 — seven weeks into FY2023. FY2024 (adopted Sept 2023) was the first budget they voted on; every budget and bond since has passed with their votes.
Primary documents: Sarasota County ACFRs · North Port ACFRs · Venice finance · City of Sarasota finance · Longboat Key finance